
Pinellas County Car Accident Statistics 2018-2022
Get a Free Consultation
An overview of Pinellas County car accident statistics and other vehicle crash data from the Florida Department of Highway Safety and Motor Vehicles (FLHSMV).
Pinellas County Car Accident Statistics
There were 15,682 total crashes in Pinellas County in 2022, a 12% decrease from 17,875 crashes in 2018.
Injury crashes are down 15% over the same period, from 7,473 to 6,370, as are total crash-related injuries, down 14% from 10,751 to 9,220.
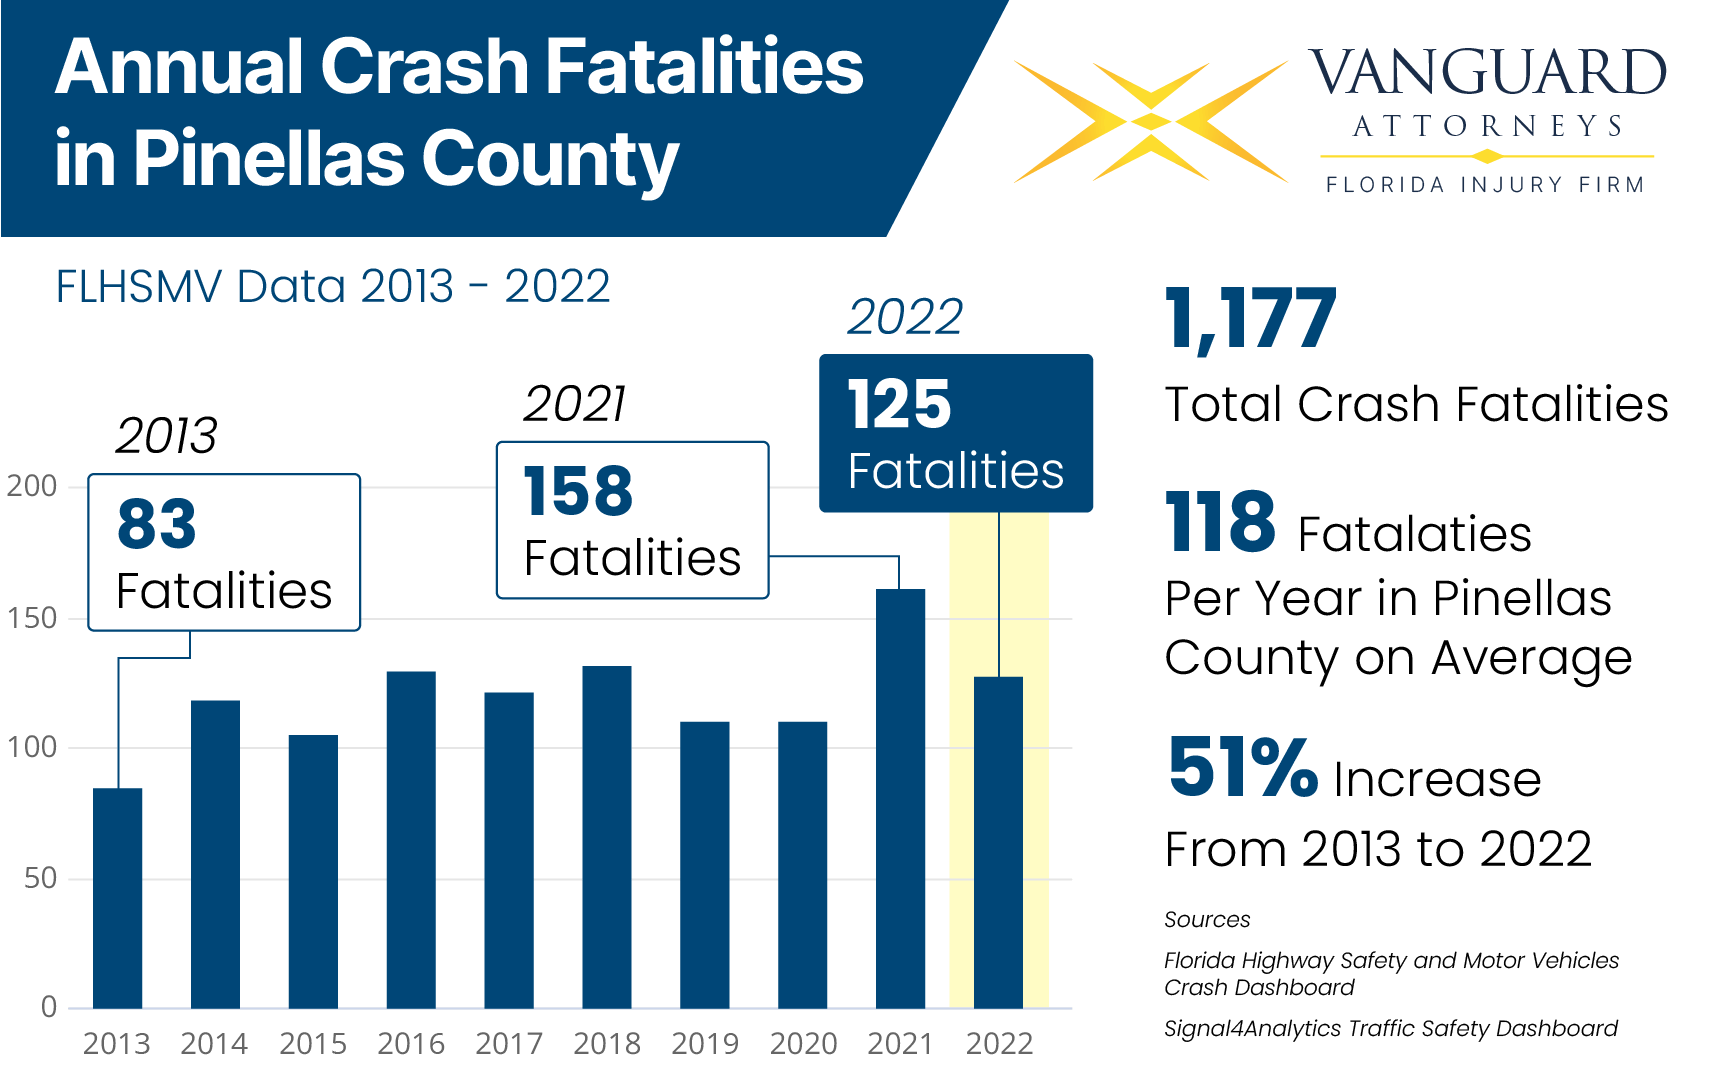
Despite the 12% drop in total crashes, crash fatalities in Pinellas County only decreased by 3%, from 130 deaths in 2018 to 126 in 2022.
With the total number of licensed drivers in Pinellas County increasing by 1% in this timespan, the reductions in total crashes, injuries, and fatalities indicate promising improvements in road safety.
Crashes by Vehicle Type in Pinellas County
Breaking down crash statistics by vehicle type paints a more nuanced picture.
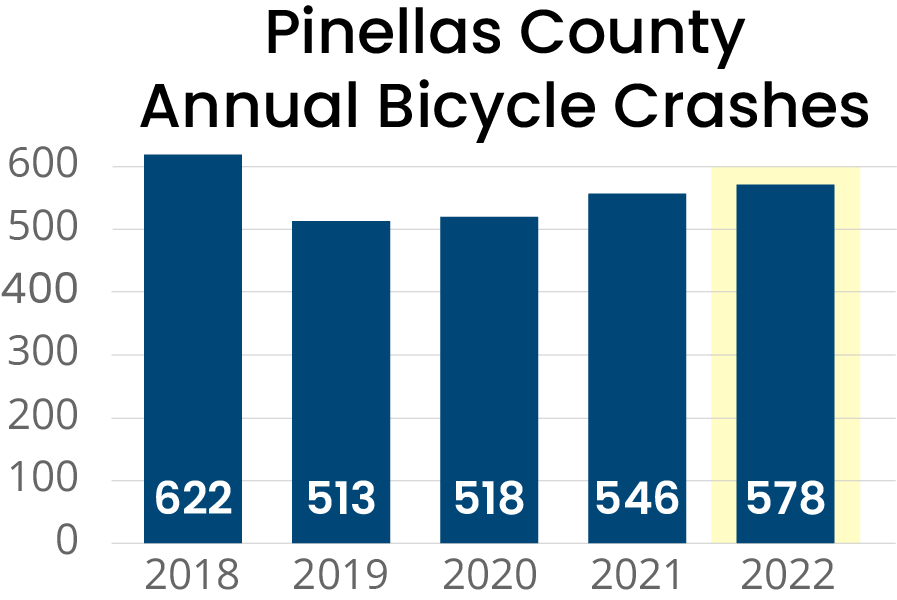
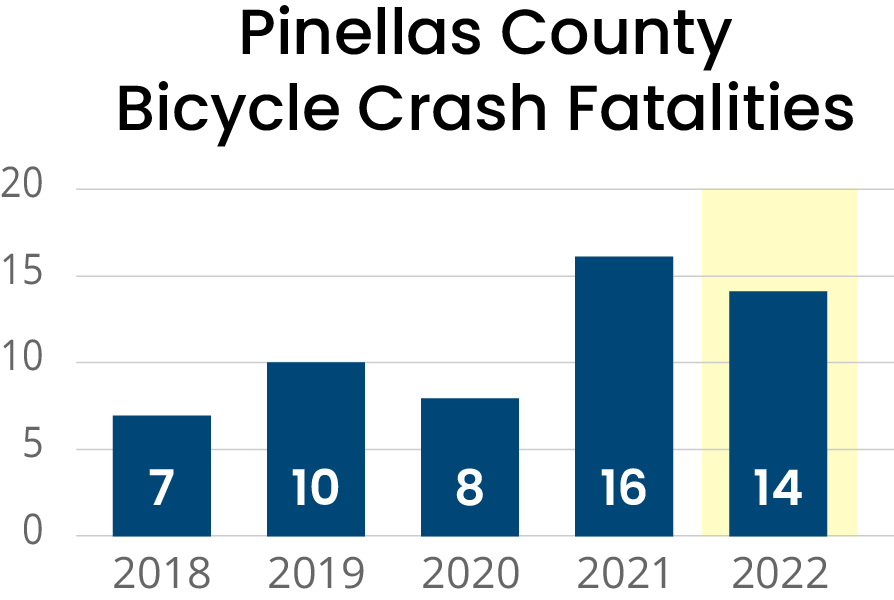
While bicycle crashes are down 7% since 2018, bicycle fatalities have actually doubled from 7 deaths in 2018 to 14 deaths in 2022.
So bicycling appears to have gotten safer overall, but when crashes do occur, they are more likely to be fatal.
Motorcycle crashes followed a similar trend. While total motorcycle crashes fell 13% from 503 in 2018 down to 437 in 2022, deaths rose from 29 to 35 over the same 5-year stretch — a 21% increase.
In contrast, pedestrian crashes decreased by 6% and fatalities decreased slightly from 41 to 37 over the period examined.
Hit-and-run crashes also fell 10% to 4,471 in 2022, although hit-and-run fatalities increased slightly from 9 to 10.
Continued infrastructure improvements, vehicle safety features, education campaigns, and traffic law enforcement should remain priorities to sustain this positive momentum in enhancing Pinellas County road safety through 2023 and beyond.
Pinellas Bicycle Accidents Are Less Frequent, More Deadly
The data shows that while overall bicycle crashes have fallen 7% from 622 in 2018 to 578 in 2022, deaths involving bicycles have significantly increased, doubling from 7 fatalities in 2018 to 14 fatalities in 2022.
Several strategies may help prevent bicycle crashes and reduce risks for riders in Pinellas County.
Improved infrastructure is key. Expanding bike lanes, enhancing lighting, and improving road signage and markings can all help separate bikes from cars and increase visibility.
Pinellas County can conduct thorough safety assessments of popular biking routes to address any infrastructure gaps placing cyclists at risk.
Education for all road users creates a culture of understanding. Safety seminars should educate cyclists, motorists, and pedestrians on road rules and safe habits around bicycles.
This includes using bike lights at night, avoiding distracted driving near bikes, and strict adherence to right-of-way laws.
Safety equipment saves lives. While Florida does not require adult cyclists to wear helmets, strongly promoting their use could significantly reduce cycling fatalities resulting from head injuries.
Decrease in Hit-and-Run Crashes in Pinellas
Hit-and-run crashes refer to accidents where a driver collides with a person, vehicle, or object and then flees the scene without providing identification or assistance.
FLHSMV data shows a decrease in hit-and-run crashes in Pinellas County over the past five years.
Total hit-and-run crashes fell from 4,985 in 2018 to 4,471 in 2022, a 10% drop.
Hit-and-run injuries decreased as well, falling 12% from 987 injured in hit-and-run collisions in 2018 down to 869 injured in 2022.
However, hit-and-run fatalities increased slightly from 9 deaths in 2018 to 10 deaths in 2022.
This could indicate that remaining hit-and-run drivers are driving more recklessly and at higher speeds when they hit pedestrians or collide with other vehicles.
Strategies to continue reducing dangerous hit-and-run incidents could include public messaging about legal penalties and the importance of stopping after collisions, along with improved street lighting and speed limit enforcement.
Conclusion
The 2022 car accident statistics and vehicle crash data for Pinellas County show a meaningful reduction in total accidents and injuries over the past 5 years.
This trend provides some optimism that infrastructure improvements, public education campaigns, and other safety initiatives are having a positive impact.
In 2022, Pinellas County had 12.7 motor vehicle crash deaths per 100,000 population, 20% lower than Florida’s 15.8 overall crash death rate.
Pinellas County had the 11th lowest crash death rate of Florida’s 67 counties.
That said, there is still a lot of room for improvement in Pinellas. The county should remain committed to safety initiatives to continue reducing accidents year-over-year.
The work to prevent serious injuries and fatalities on Pinellas roads never ends, but progress has been made and will hopefully continue thanks to hard-working members of the community and the collective efforts of drivers to make roadways safer.