
Hillsborough County Car Accident Statistics 2022
Get a Free Consultation
Hillsborough County Sees Rise in Crashes in 2022
An analysis of finalized 2022 Hillsborough County crash data from the Florida Highway Safety and Motor Vehicles (FLHSMV) reveals an upward trend in crash frequency and fatalities.
Hillsborough County saw a small increase in the total number of crashes in 2022 compared to 28,356 crashes compared to 28,020 in 2021.
19,273 injuries occurred in crashes in Hillsborough County in 2022, a 3% increase from 2021. However, fatalities decreased from 271 to 228.
The data from FLHSMV provides insights into crash trends in the county across different vehicle types and crash factors.
Among crash types, hit-and-run incidents have shown the most persistent rise year over year. Hillsborough saw another all-time high of 7,505 hit-and-run crashes in 2022—up 17% from 2018 and representing over a quarter of total crashes in the county.
While fatal hit-and-runs declined to 14 deaths, the number of injuries from fleeing drivers has climbed 16% over five years to 1,874 in 2022. 83% of hit-and-run fatalities in Hillsborough occur at night.
Overall, our analysis of Hillsborough County car accident statistics and motor vehicle crash data reveals a staggering increase in traffic fatalities, especially in crashes involving pedestrians, bicyclists, and motorcyclists.
These worrying statistics underscore the need for expanded safety initiatives and infrastructure improvements to reverse accident trends.
How Many Crashes and Fatalities Occur Each Year in Hillsborough County?
On average, 27,747 total crashes occurred in Hillsborough County each year from 2018-2022. Of these, about 44% of crashes involved injuries resulting in 18,866 individuals being injured each year.
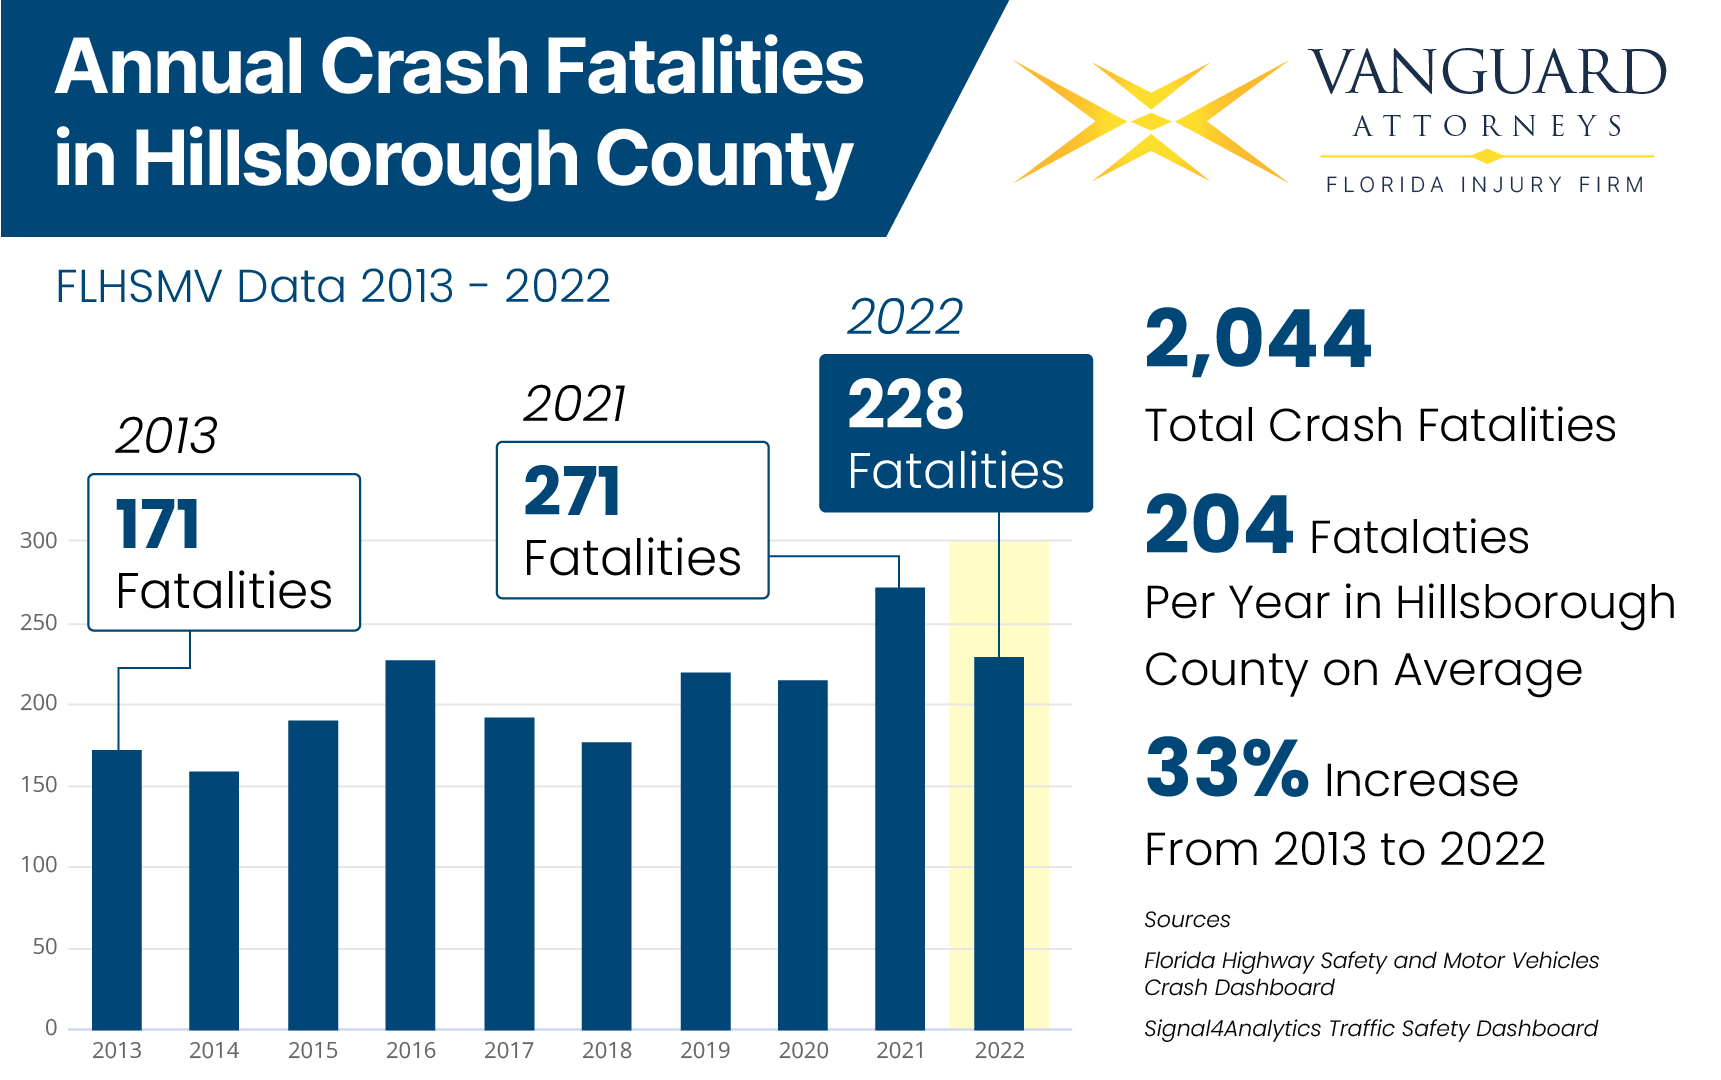
209 fatal crashes occurred annually on average, costing 221 lives and impacting countless more as families and friends of victims cope with the loss of a loved one.
Note: Excluding 2020 from the data increases the average to 28,642 crashes annually. 2020 had 16% fewer crashes than the other years due to reduced travel during the height of the COVID-19 pandemic.
Increase in Crash Fatality Rate
The total number of traffic fatalities in Hillsborough County has risen sharply from 176 deaths in 2018 to 228 in 2022 — a 30% increase over the five-year analysis period.
The 30% growth in crash fatalities from 2018-2022 far outpaces the 6% increase in licensed drivers in the county over the same period, meaning the crash fatality rate per licensed driver in the county has risen sharply.
As shown in the chart below, Hillsborough crash fatalities increased from 2013 to 2016, decreased by 2018, but bounced back in 2019. Accident deaths peaked in 2021 with 271 fatalities and decreased 16% in 2022.
Rate of Injury
The county saw 12,144 injury collisions and 19,273 total crash injuries in 2022 — a slight decrease from pre-pandemic 2018, but a 3% increase in total injuries compared to 2021.
Hillsborough residents should not accept this injury rate as the status quo. More work is needed to make roads safer in our community.
Pedestrian, Bicycle, and Motorcycle Crashes Increase
Vulnerable road users including pedestrians, cyclists, and motorcyclists have faced heightened dangers on Hillsborough streets.
Pedestrian deaths have increased from 52 fatalities in 2018 to 59 in 2022, a 13% rise.
Pedestrian safety initiatives like lower speed limits, improved lighting, and sidewalk maintenance could help reverse this trend.
Similarly, cyclist fatalities increased by 64%, to 18 deaths in 2022. Expanding bike lanes and other separation infrastructure may provide Hillsborough riders more protection.
Motorcycle deaths grew by 58% from 31 in 2018 to 49 in 2022. High-visibility enforcement and guardrail improvements may help mitigate motorcycle crash factors like excessive speeding and roadway barriers.
Hillsborough Crashes by Vehicle
Breaking down the data by vehicle reveals a sharp increase in the severity of incidents involving pedestrians, bicyclists, and motorcyclists.
Pedestrian Crash Statistics
In 2022, 657 crashes involved pedestrians in Hillsborough County, resulting in 59 fatalities. Compared to 2018, pedestrian crashes rose by 17% and lives lost increased by 13%.
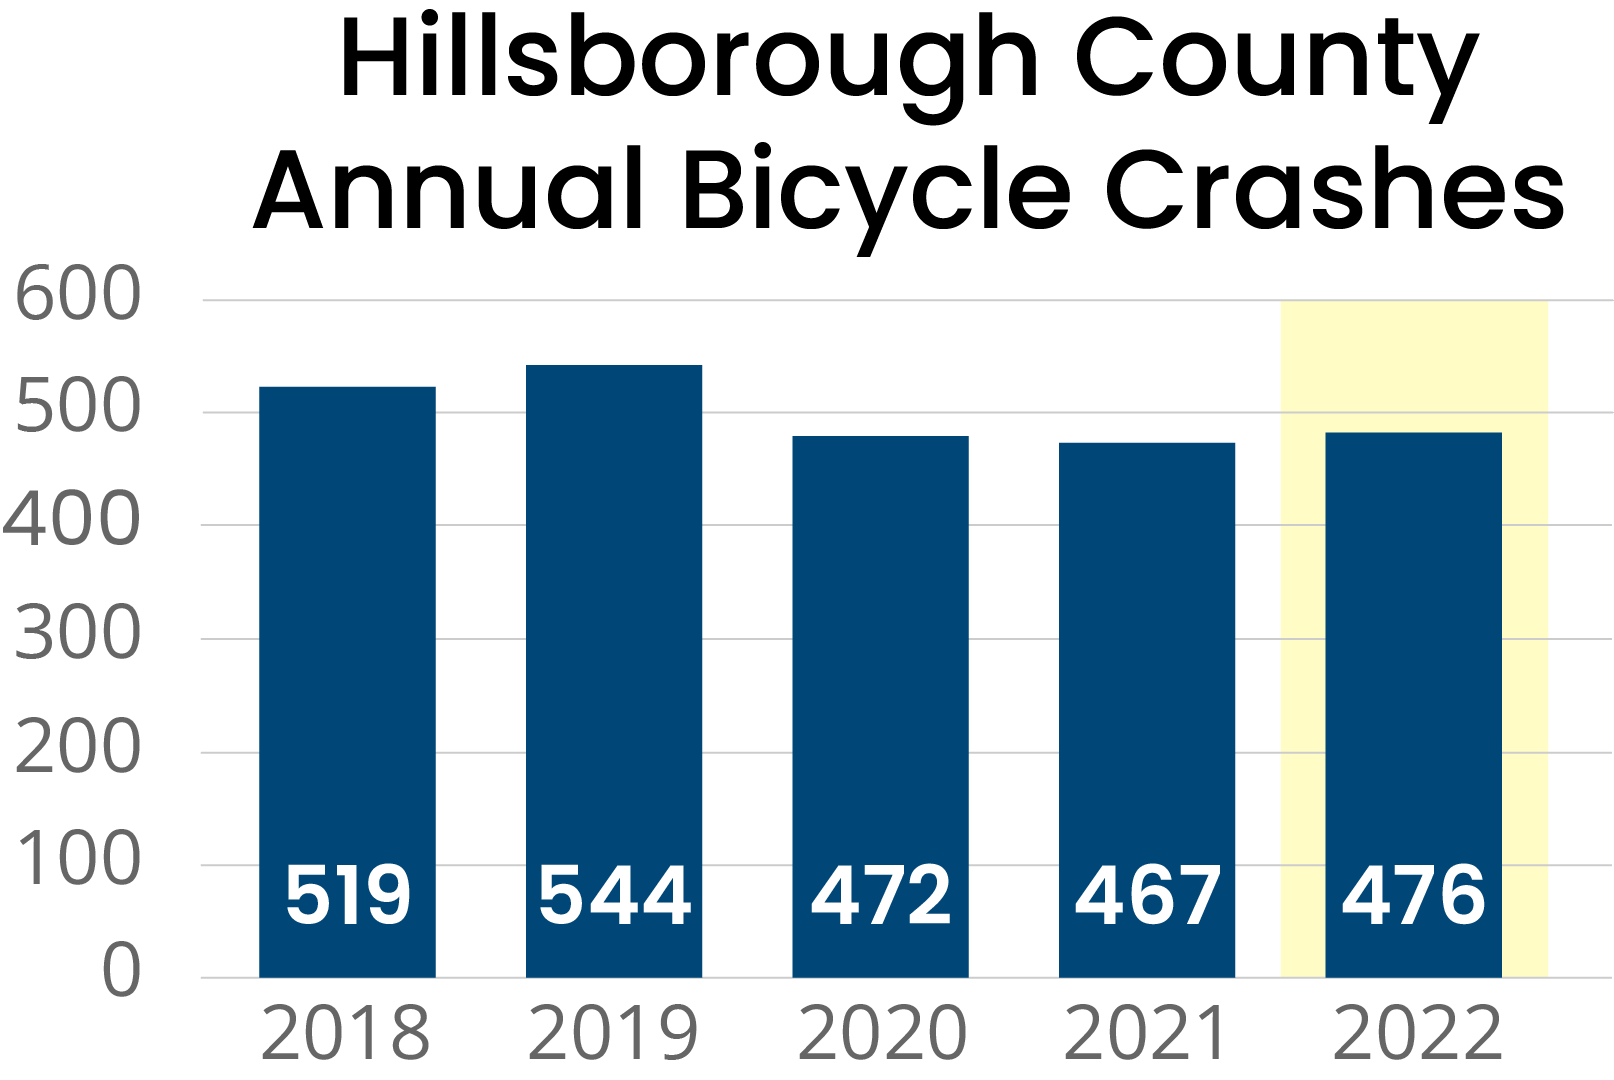
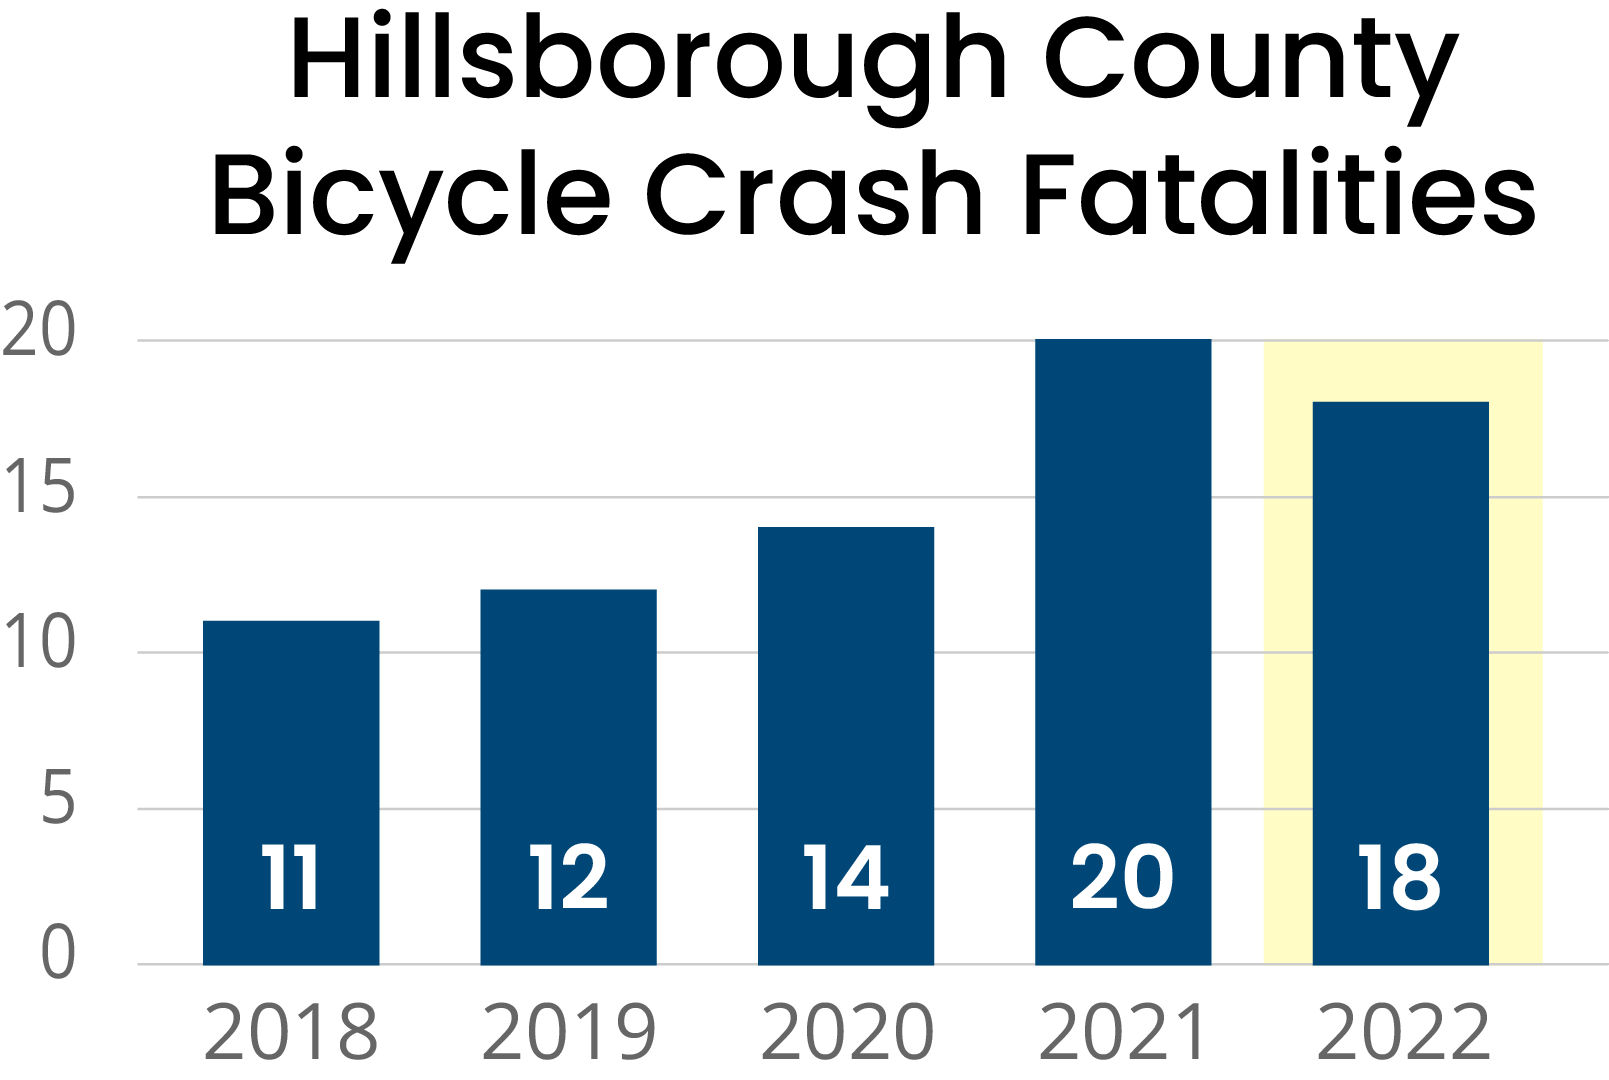
Bicycle Crash Statistics
Hillsborough County recorded 476 bicycle crashes in 2022, an 8% decrease from 2018. However, bicycle accident fatalities sharply increased by 64% from 11 deaths in 2018 to 18 fatalities in 2022.
More research is needed to determine what caused bicycle crashes to become more fatal after 2020.
Motorcycle Crash Statistics
Similarly, motorcycle crashes decreased by 8% from 656 incidents in 2018 to 603 in 2022. Meanwhile, fatalities surged upwards by 58% from 31 lives lost in 2018 to 49 motorcycle crash deaths in 2022.
This data highlights the risks disproportionately faced by pedestrians, bicyclists, and motorcyclists in traffic crashes compared to car and truck drivers.
Infrastructure limitations, right-of-way disputes, lack of segregation facilities, and challenges managing visibility and speed differentials are among the factors that exacerbate dangers for vulnerable road users.
Hit-and-Run Crashes Compound Harm
The rise of hit-and-run crashes from 2018 to 2022 reflects another dimension exacerbating the road safety crisis and threatening public well-being in Hillsborough County.
7,505 hit-and-run crashes occurred in 2022, a 17% increase compared to 2018. Injuries resulting from hit-and-run crashes increased 16% to 1,874.
Additionally, while hit-and-run incidents accounted for 22% of all crashes in 2018, 26% of crashes were classified as hit-and-runs in 2022.
Hit-and-run incidents are more likely to result in fatalities by delaying medical assistance and emergency response.
Moreover, the lack of responsibility assumed by hit-and-run offenders obstructs crash investigations and prevents liability claims to support treating crash victims.
The FLHSMV urges drivers to stay at the scene after a crash to ensure everyone involved receives proper medical attention. It’s not just the law, you may be saving a life.
Impact of the COVID-19 Pandemic
As anticipated, travel restrictions and fewer employees commuting during the height of the COVID-19 pandemic contributed to a 16% drop in total crashes from 2019 to 2020.
However, those gains were short-lived as crashes, injuries, and fatalities all increased substantially in 2021 and remained high in 2022.
In 2021, Hillsborough County recorded 158 fatalities, an all-time high. Compared to 2018, fatalities in 2021 increased by 54%.
This suggests that the decrease in accidents was primarily due to reduced traffic during lockdown periods since the severity of crashes surged drastically after stay-at-home orders were lifted.
Recommendations for Improving Hillsborough Road Safety
This analysis of the most recent five years of Hillsborough County car accident statistics and vehicle crash data highlights the increased risk pedestrians and motorists face from traffic crashes in our community.
These statistics underscore the need for action to prevent crash fatalities and injuries on Hillsborough County roads.
Strategic interventions involving infrastructure upgrades and education programs should be considered to protect road users and promote safe driving habits.
If you’re injured in an auto accident in Hillsborough County, contact a Tampa car accident lawyer to discuss your legal options.