2023 Florida Car Accident Statistics
Get a Free Consultation2023 Florida car accident statistics from January 1, 2023, to December 31, 2023. Based on official data from the FLHSMV Crash Dashboard as of January 13, 2024.
2023 Florida Car Accident Statistics Overview
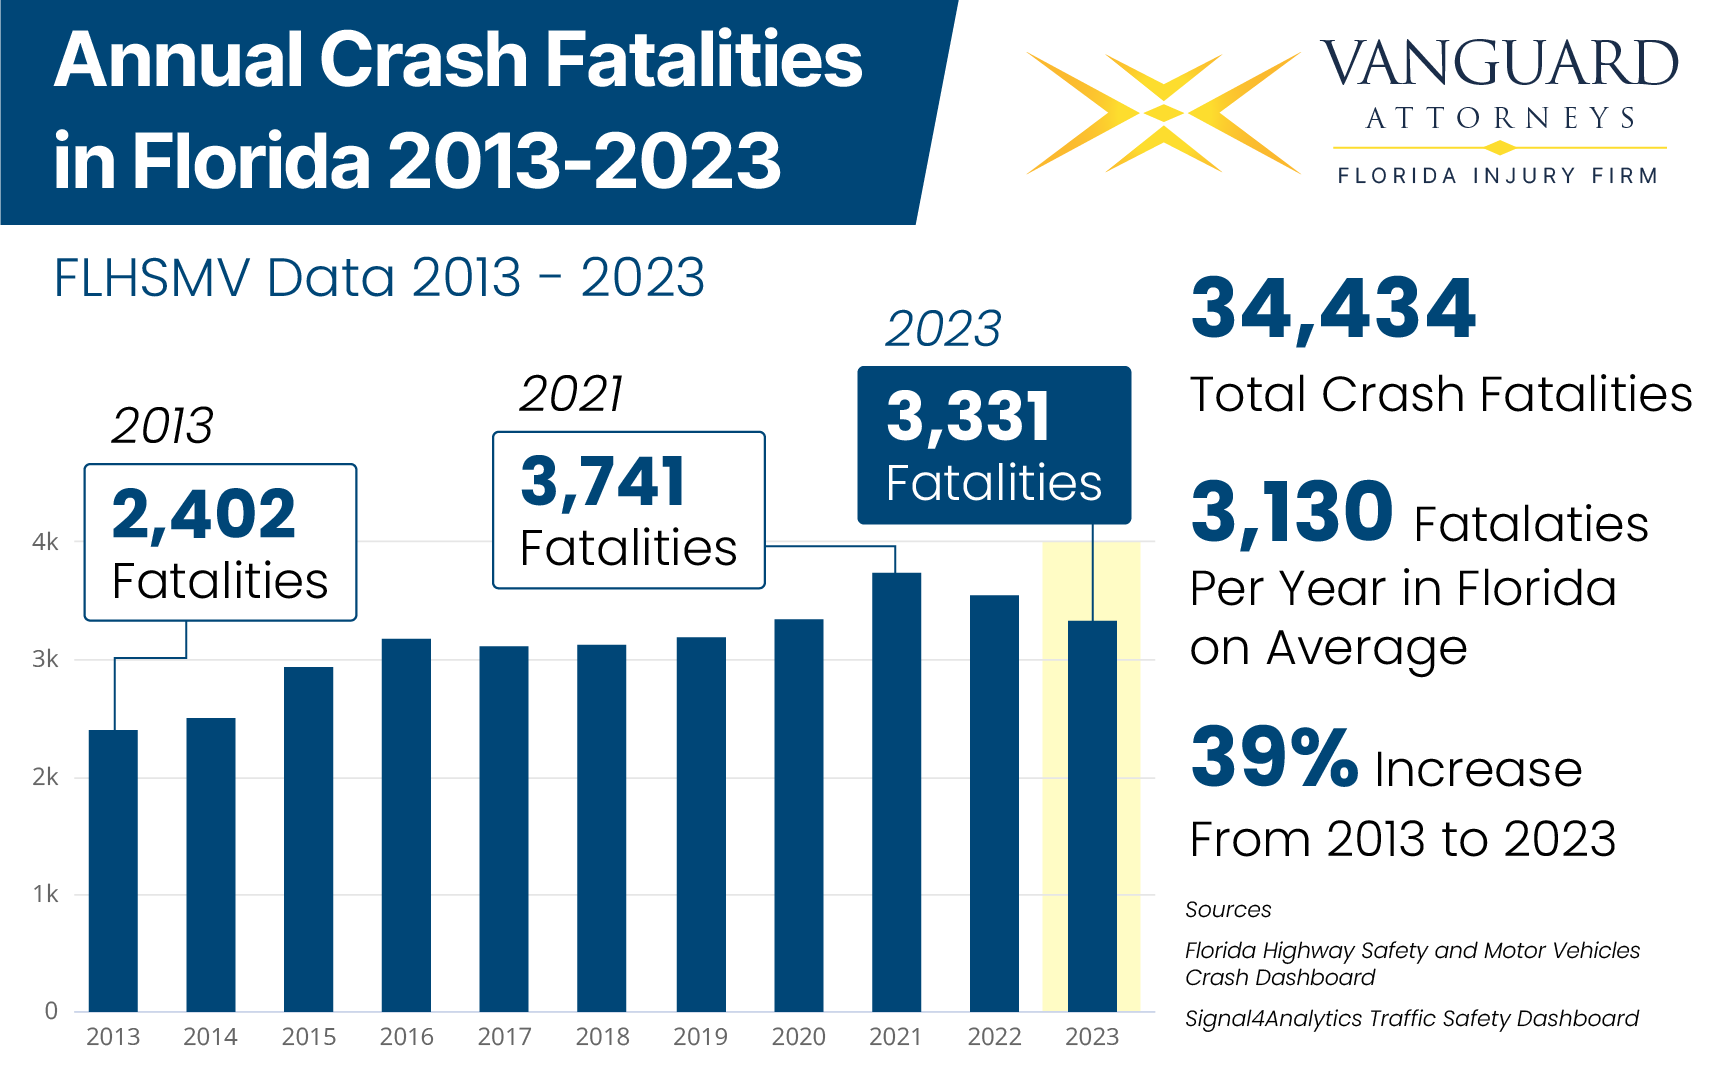
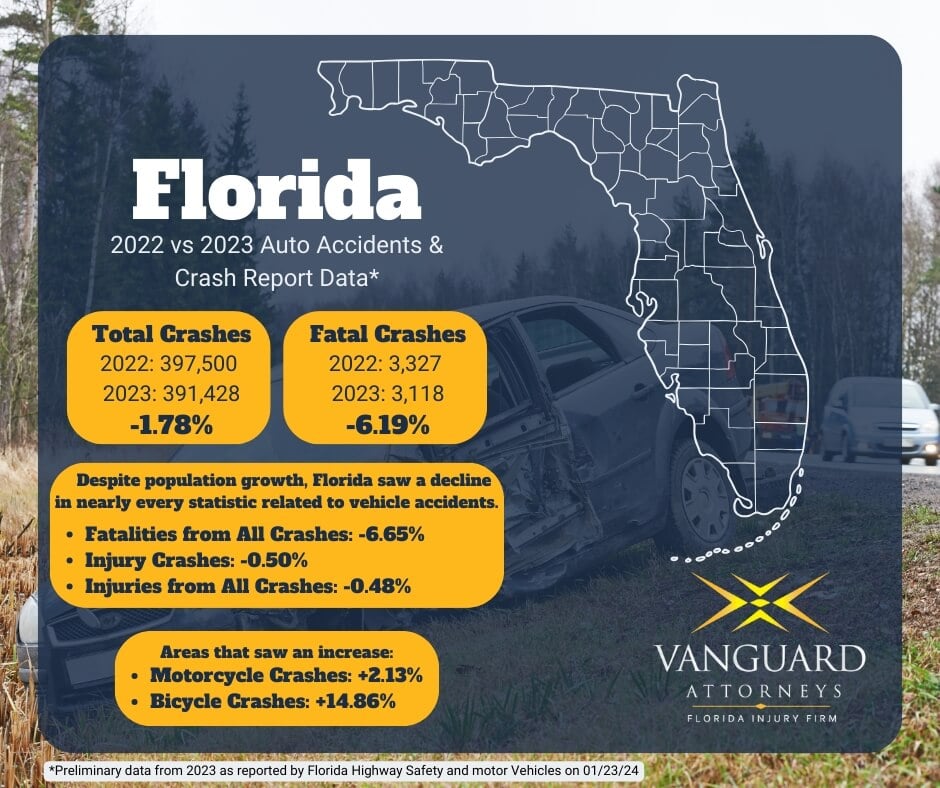
In 2023, 391,428 crashes occurred in Florida. 250,037 people were injured in crashes and there were 3,331 deaths.
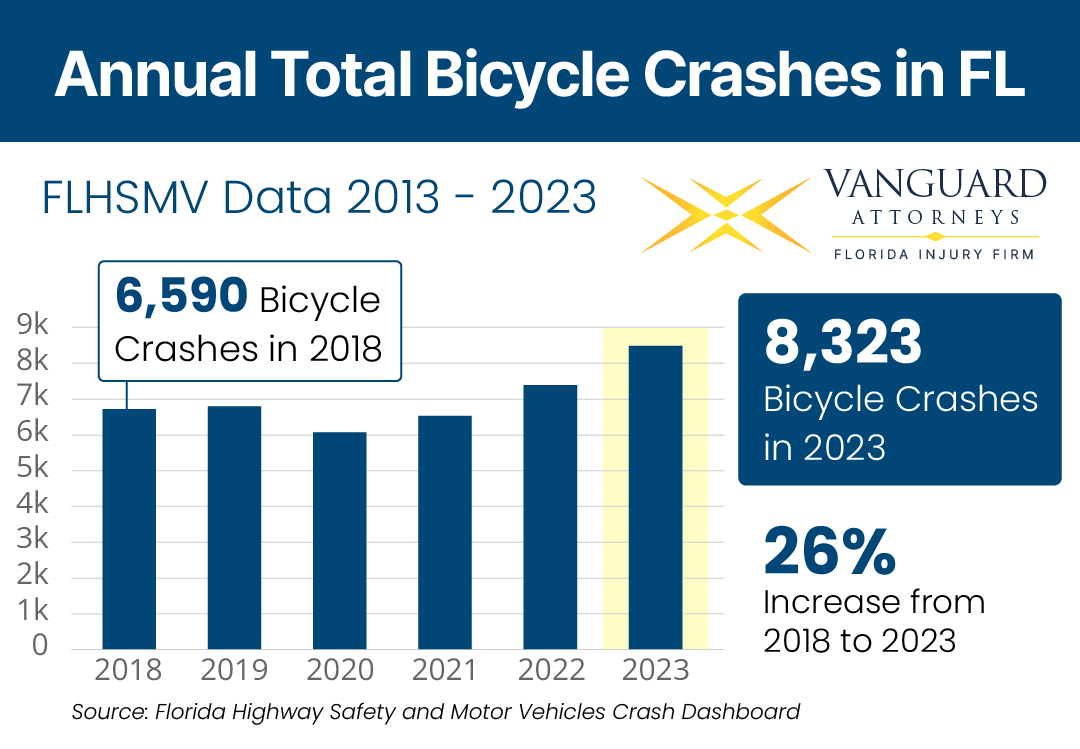
In 2023, Florida bicycle accidents reached an all-time high of 8,323. A significant increase from 7,250 bicycle crashes in 2022.
See below for a breakdown of 2023 Florida car accident statistics as well as a table of the data going back to 2018.

All Florida Car Accident Data 2018 – 2023
The table below contains aggregated data from the FLHSMV crash dashboard that was used to calculate the car accident statistics in this article.
| 2018 | 2019 | 2020 | 2021 | 2022 | 2023 | |
| All Crashes | 403,626 | 401,867 | 341,399 | 401,540 | 397,500 | 391,428 |
| Total Fatal Crashes | 2,917 | 2,951 | 3,098 | 3,454 | 3,327 | 3,118 |
| Total Fatalities From All Crashes | 3,135 | 3,185 | 3,332 | 3,741 | 3,574 | 3,331 |
| Total Injury Crashes | 167,219 | 167,020 | 140,167 | 163,956 | 163,085 | 163,001 |
| Total Injuries from All Crashes | 255,353 | 254,816 | 212,432 | 252,971 | 252,123 | 250,037 |
| Total Bicycle Crashes | 6,590 | 6,664 | 5,952 | 6,404 | 7,250 | 8,323 |
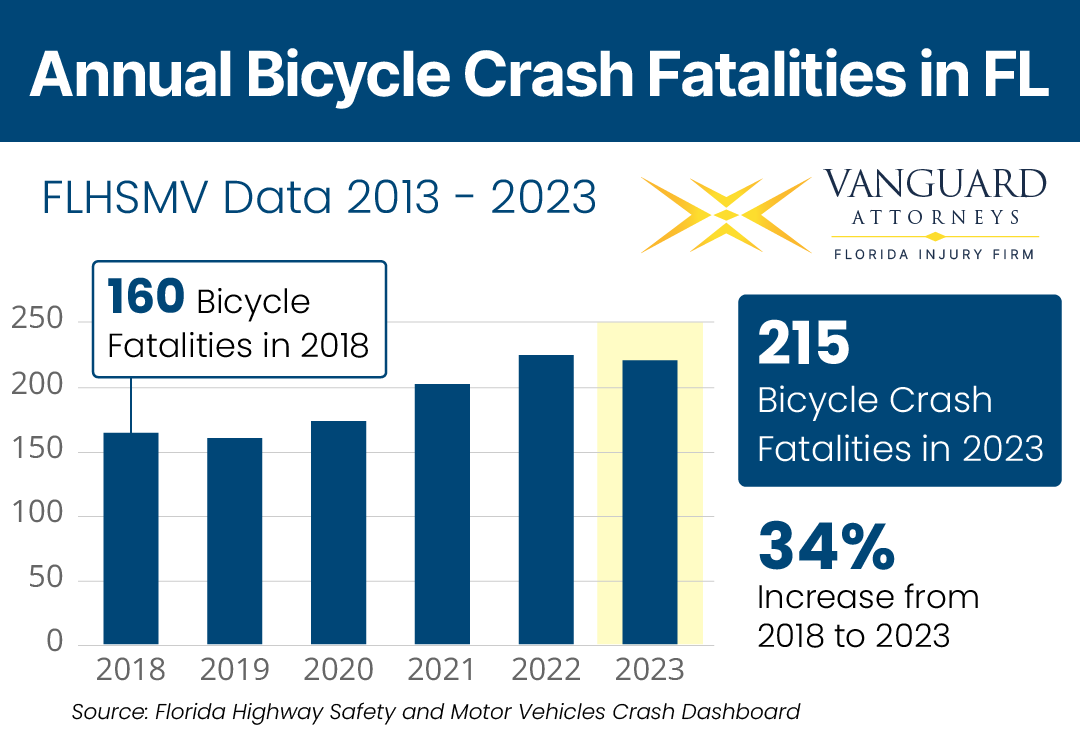
| Total Bicycle Fatalities | 160 | 156 | 169 | 197 | 219 | 215 |
| Total Motorcycle Crashes | 9,143 | 8,895 | 8,045 | 8,649 | 9,261 | 9,448 |
| Total Motorcycle Fatalities | 531 | 550 | 552 | 621 | 614 | 592 |
| Total Pedestrian Crashes | 9,356 | 9,736 | 8,114 | 9,569 | 10,198 | 10,165 |
| Total Pedestrian Fatalities | 720 | 734 | 715 | 835 | 792 | 762 |
| Total Hit and Run Crashes | 103,011 | 105,648 | 92,247 | 109,646 | 107,825 | 103,976 |
| Total Hit and Run Fatalities | 207 | 214 | 256 | 306 | 291 | 271 |
| Total Hit and Run Injuries | 21,610 | 22,401 | 20,994 | 24,379 | 23,429 | 22,395 |
Total Crashes in Florida in 2023
All reported traffic incidents in Florida, regardless of severity.
2023 Total Crashes: 397,500
2022 Total Crashes: 391,428
Percent Change: +1.55%
Fatal Crashes in Florida in 2023
Any traffic crash that results in one or more fatalities within thirty days of the crash occurrence.
2023 Fatal Crashes: 3,118
2022 Fatal Crashes: 3,327
Percent Change: -6.28%
Fatalities From All Crashes in Florida in 2023
The total number of fatalities across all crashes in Florida.
2023 Fatalities from All Crashes: 3,331
2022 Fatalities from All Crashes: 3,574
Percent Change: -6.80%
Injury Crashes in Florida in 2023
The number of non-fatal traffic crashes that resulted in one or more injuries.
2023 Injury Crashes: 163,001
2022 Injury Crashes: 163,085
Percent Change: -0.05%
Total Injuries from All Crashes in Florida in 2023
This is the total number of injuries reported across all crashes, whether fatal or non-fatal.
2023 Injuries from All Crashes: 250,037
2022 Injuries from All Crashes: 252,123
Percent Change: -0.83%
Total Bicycle Crashes in Florida in 2023
Bicycle crashes are the total number of accidents that involve bicycles, including electric bicycles.
2023 Bicycle Crashes: 8,323
2022 Bicycle Crashes: 7,250
Percent Change: +14.86%

Bicycle Fatalities in Florida in 2023
Bicycle fatalities are deaths resulting from accidents that involve bicycles.
2023 Bicycle Fatalities: 215
2022 Bicycle Fatalities: 219
Percent Change: -1.83%

Total Motorcycle Crashes in Florida in 2023
Motorcycle crashes are the total number of accidents that involved a motorcycle. In Florida, a motorcycle is considered any motor vehicle with a seat or saddle for rider, designed to travel with fewer than four wheels on the ground, excluding tractors and mopeds.
2023 Motorcycle Crashes: 9,448
2022 Motorcycle Crashes: 9,261
Percent Change: +2.13%
Motorcycle Fatalities in Florida in 2023
Motorcycle fatalities are the number of people who died from a crash while operating a motorcycle.
2023 Motorcycle Fatalities: 592
2022 Motorcycle Fatalities: 614
Percent Change: -0.97%
Total Pedestrian Crashes in Florida in 2023
Pedestrian crashes are accidents that involved a pedestrian. In Florida, a pedestrian is any individual who is not in a car, bicycle, or other vehicle. Pedestrians are also called non-motorists.
2023 Pedestrian Crashes: 10,165
2022 Pedestrian Crashes: 10,198
Percent Change: -0.32%
Pedestrian Fatalities in Florida
Pedestrian fatalities are the number of people who died from a crash who were not in a car, bicycle, or other vehicle.
2023 Pedestrian Fatalities: 762
2022 Pedestrian Fatalities: 792
Percent Change: -3.41%
Total Hit-and-Run Crashes in Florida in 2023
Hit-and-run crashes are accidents where a driver failed to remain at the scene after any crash that resulted in property damage, bodily injury or death where a driver failed to remain at the scene.
2023 Hit-and-Run Crashes: 103,976
2022 Hit-and-Run Crashes: 107,825
Percent Change: -3.65%
Hit-and-Run Fatalities in Florida in 2023
Hit-and-run fatalities are the number of deaths resulting from crashes where a driver failed to remain at the scene.
2023 Hit-and-Run Fatalities: 271
2022 Hit-and-Run Fatalities: 271
Percent Change: -6.20%
Hit-and-Run Injuries in Florida in 2023
Hit-and-run injuries are the total number of people who were injured as a result of a traffic crash where a driver failed to remain at the scene.
2023 Hit-and-Run Injuries: 22,395
2022 Hit-and-Run Injuries: 23,429
Percent Change: -4.25%
As Tampa car accident attorneys, we see the impact of these car accidents on a daily basis. There is a lot of room for improvement, especially when it comes to bicycle accidents.
Remember, the best way to avoid a crash is to remain vigilant and free from distraction while driving. Call (813) 471-4444 for a free consultation with a car accident lawyer if you’re injured in a car accident in Florida.

